|
2016 Election Results Broken Down by Race and GenderChris MenahanInformationLiberation Dec. 28, 2016 |
Popular 
House Passes NDAA With Section 219 Aimed at 'Merging' U.S. and Israeli Militaries

Netanyahu Confirms Plan to 'Merge' U.S. and Israeli Militaries

Sen. Lindsey Graham Dead at 71

Sen. Graham Worked With Israeli Officials to Push GOP Senators to Pass Aid Package, Amb. Reveals

Israel Told Trump of 'Iranian Assassination Plot' Before He Declared MoU 'Over,' Report Suggests
 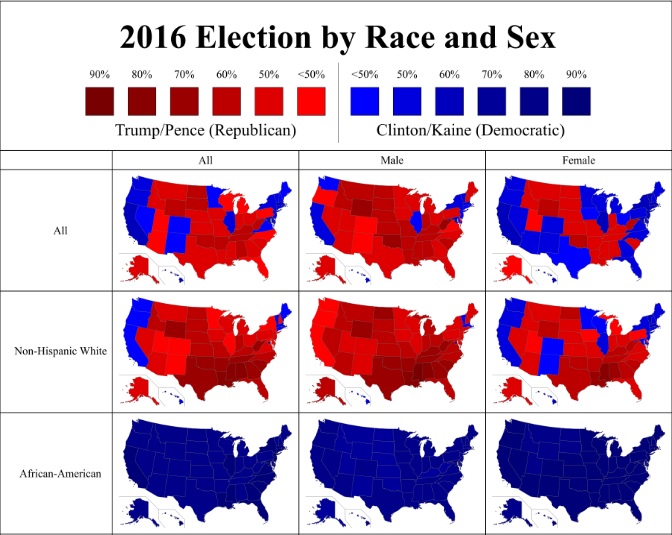 If you ever wondered why the Democrats are so intent on "fundamentally transforming" America demographically, look no further. If you ever wondered why the Democrats are so intent on "fundamentally transforming" America demographically, look no further. ReagentAH writes: The electorate in this model is 73% White, 12% African-American, 10% Hispanic, 3% Asian, and 2% Other. 52% Female and 48% Male. These numbers were chosen on the basis of historic trends (in terms of how much the exit polls undersample or oversample certain parts of the electorate), and current data on racial turnout available in a few states. The American Community Survey will provided definitive numbers on the composition of the electorate sometime in mid-2017, but until then, this is the best estimate I believe we have. 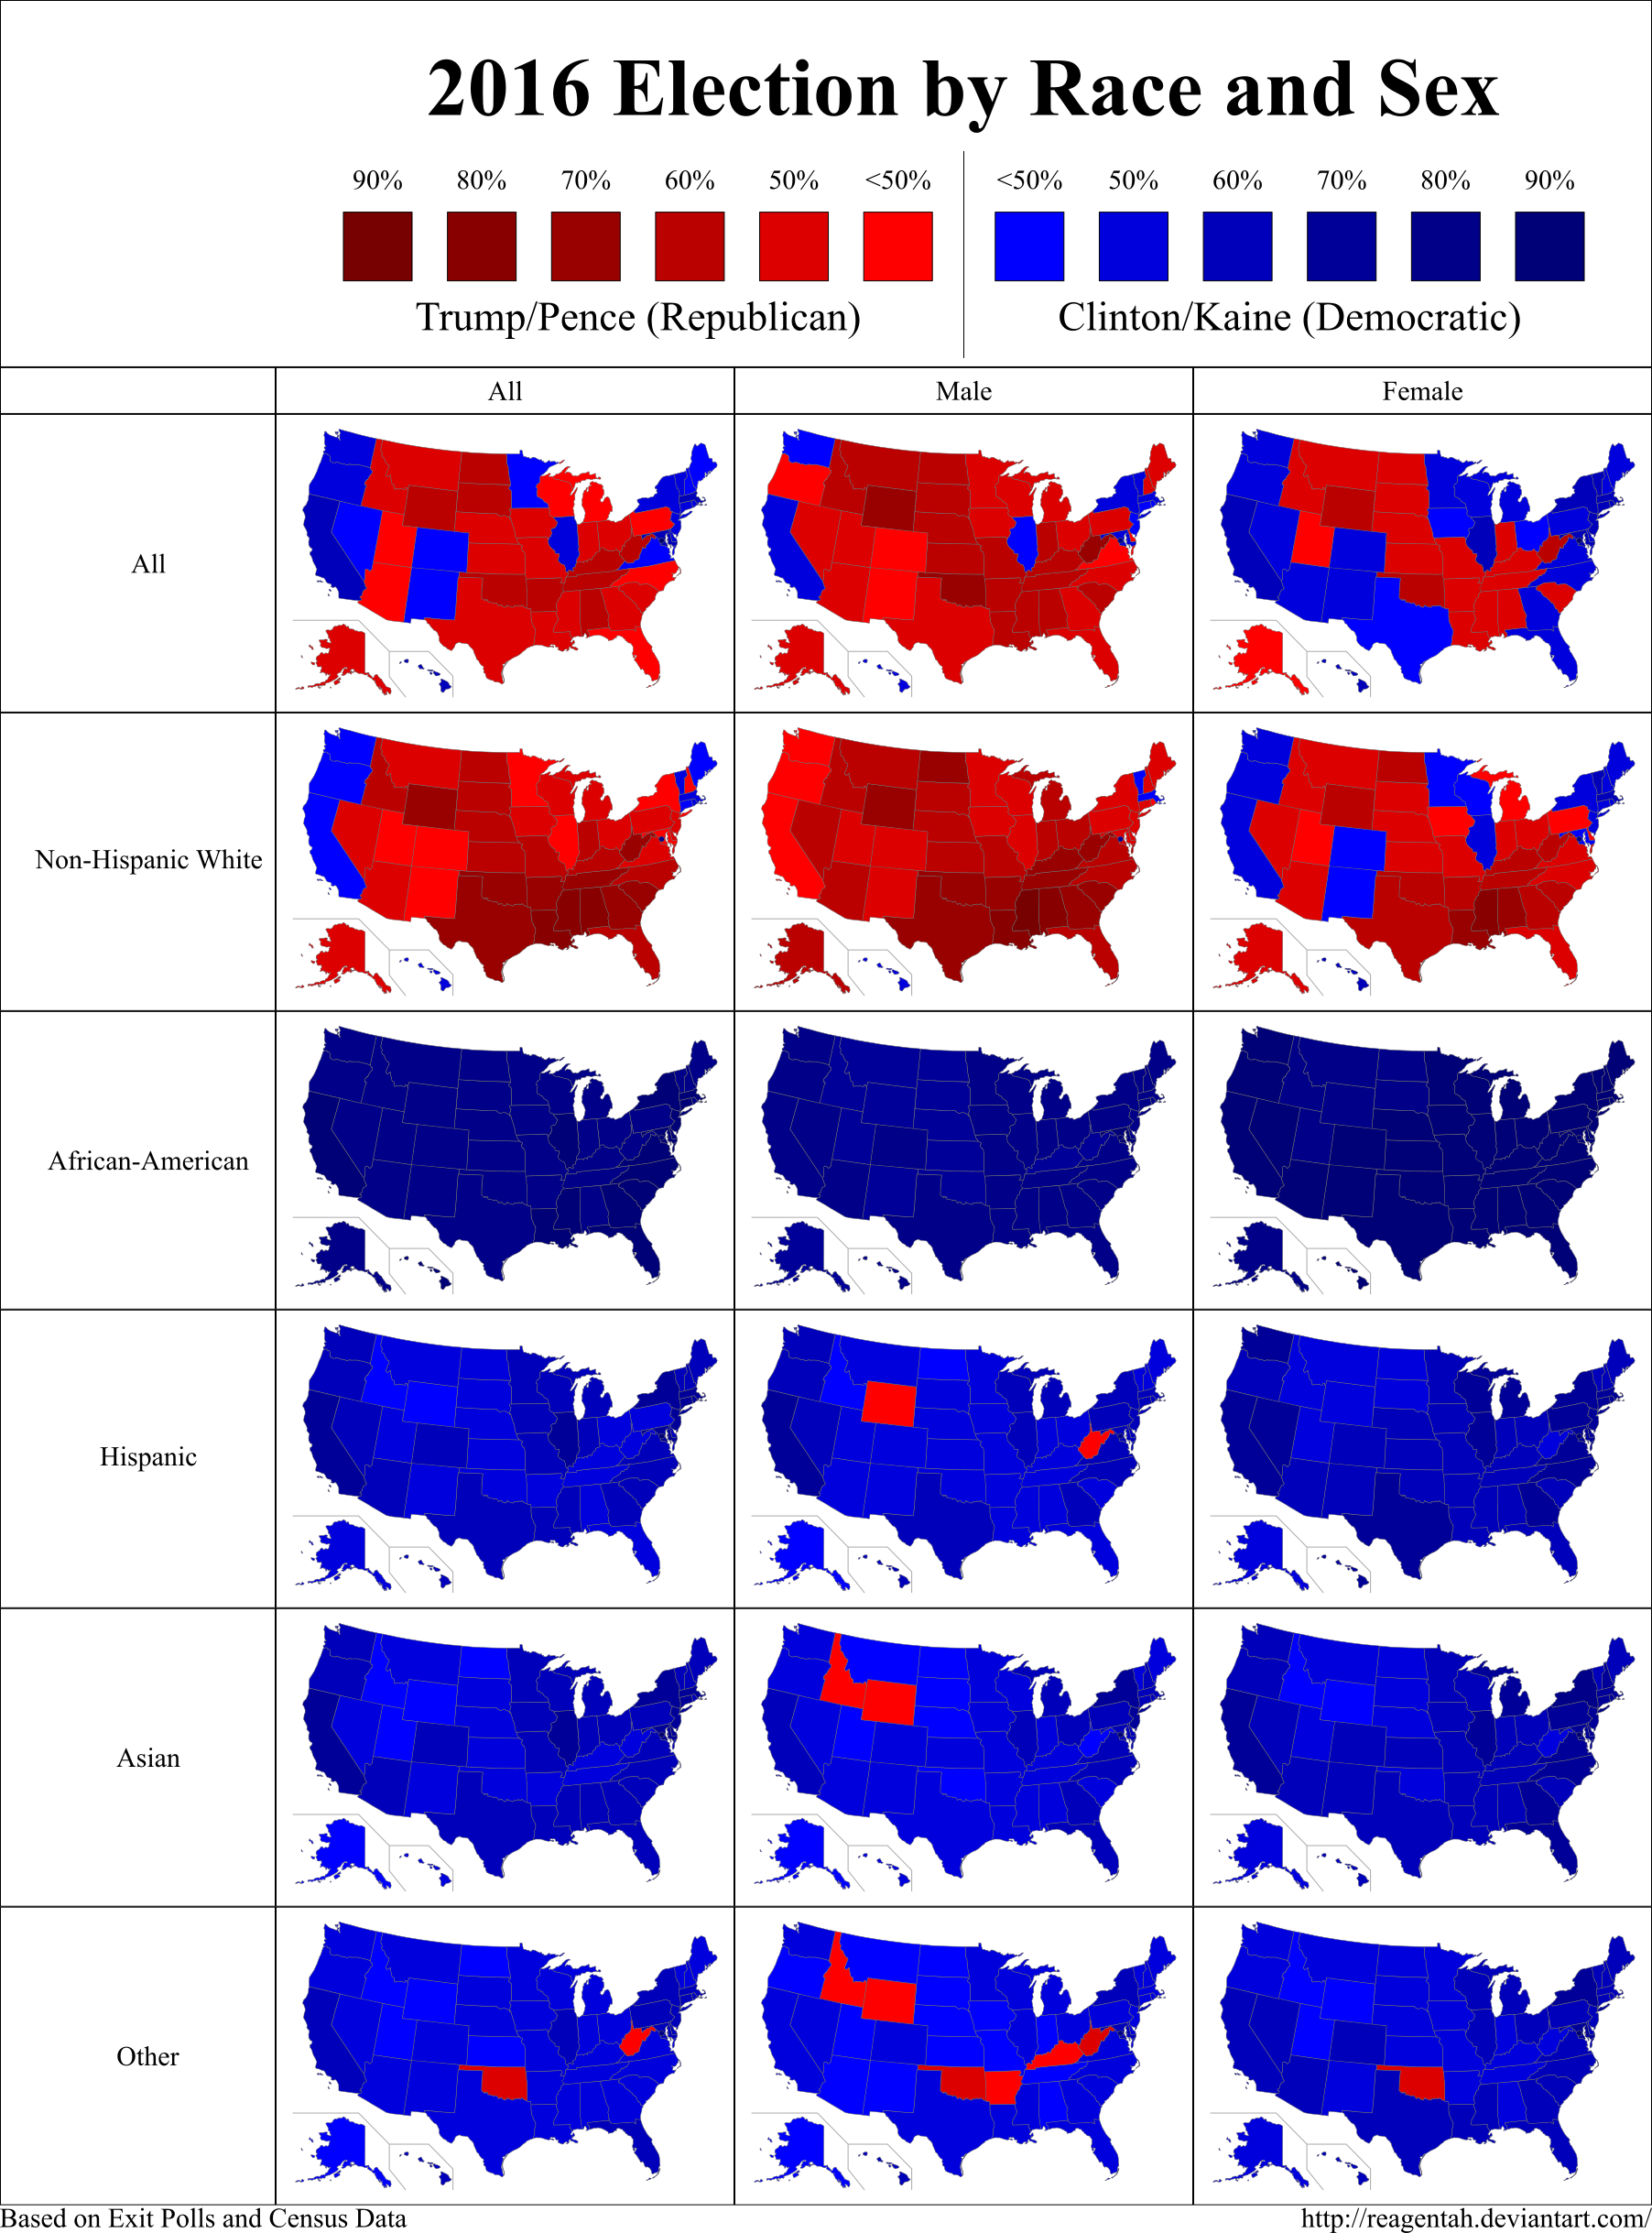 Here's Trump's vote share by race: 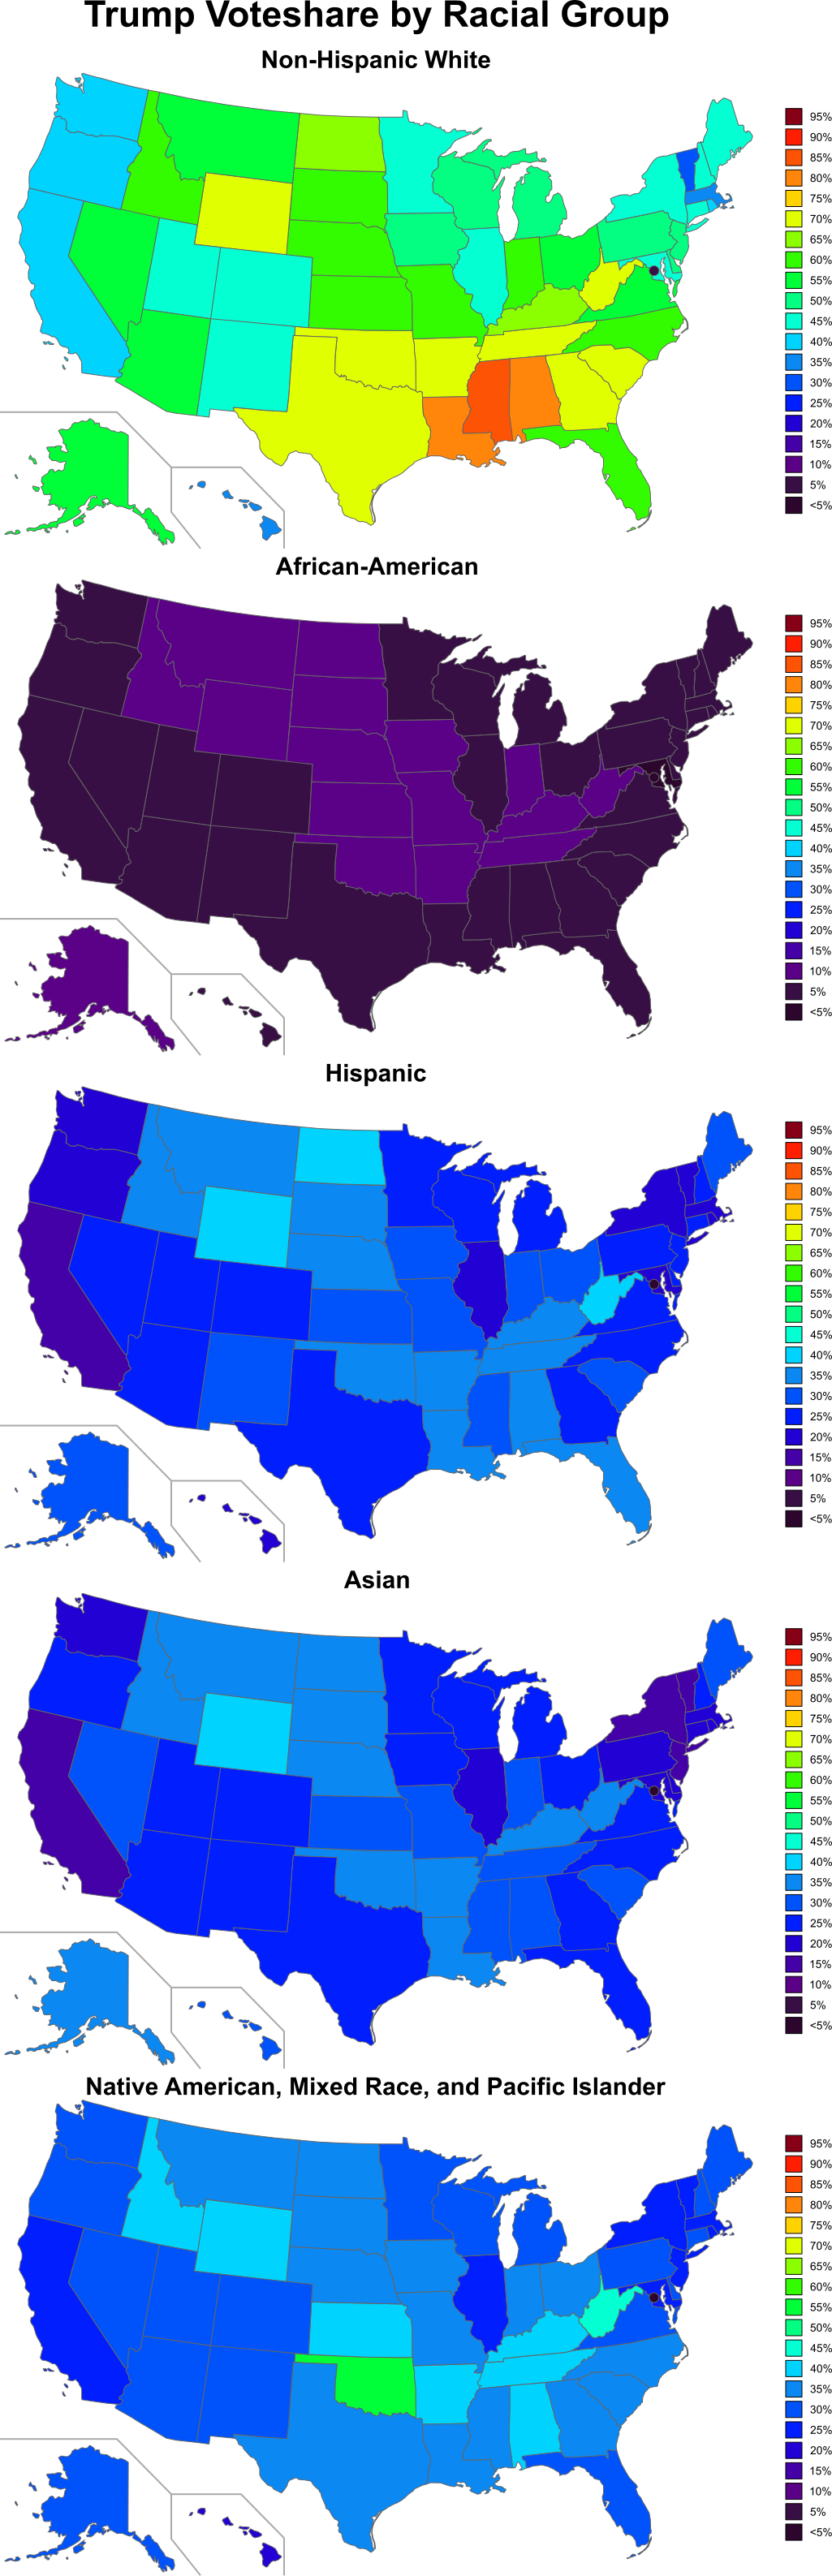 Here's a breakdown showing how whites voted in 2012 for Romney and then in 2016 for Trump: .png) 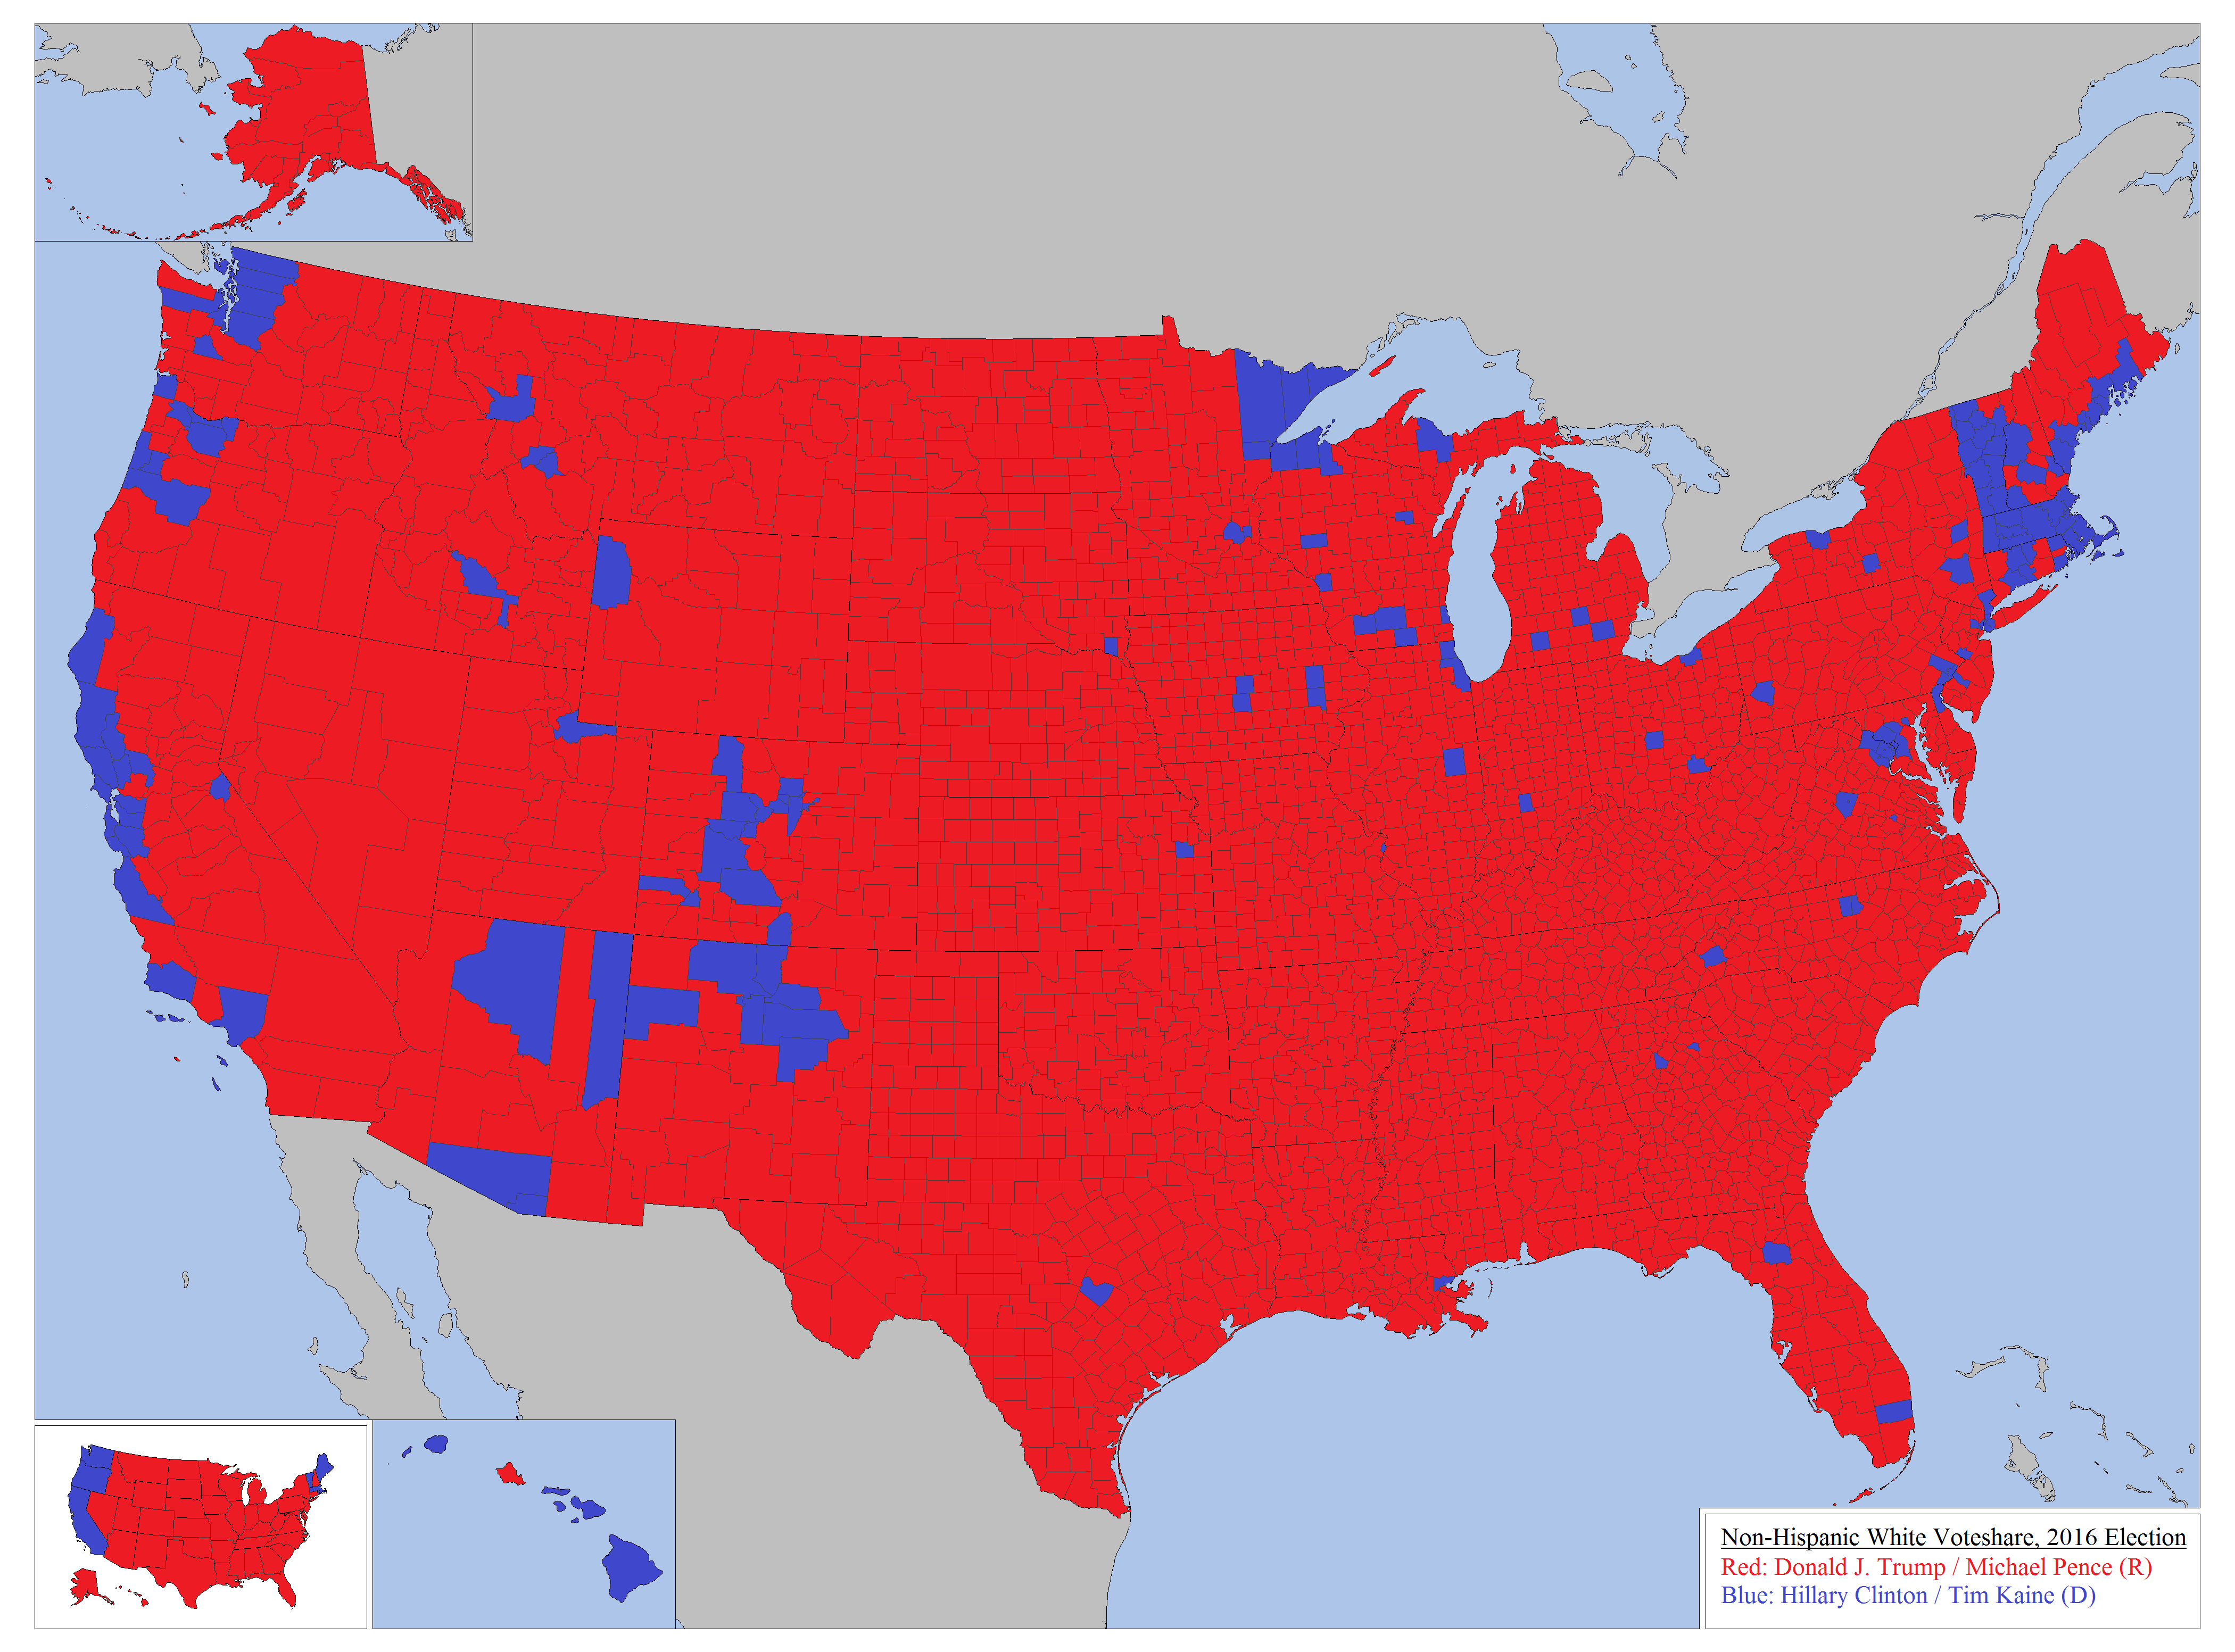 Demographics are destiny. Follow InformationLiberation on Twitter and Facebook. |


